Influxdb
Influxdb简介
Influxdb是一个开源的时序数据库,由Go语言编写而成,由InfluxData公司开发和维护。它被设计用于处理大量时间序列数据,例如监控数据、物联网数据、金融数据等。Influxdb具有以下特点:
- 高性能:Influxdb使用Go语言编写,具有高性能和低延迟的特点。
- 灵活的数据模型:Influxdb使用一种称为TSM(Time Series Merge)的数据模型,可以高效地存储和查询时间序列数据。
- 相比于Prometheus,Influxdb更适合存储和查询大量的时间序列数据,而Prometheus更适合存储和查询少量的时间序列数据。
- 数据只写不改:Influxdb的数据只写不改,一般之用来存储表达某种状态的数据 ,比如温度、内存使用率、磁盘使用率等。
Influxdb行协议
Influxdb使用一种称为行协议的格式来存储数据。行协议是一种简单的文本格式,用于表示时间序列数据。行协议的格式如下:
- 测量名称:测量名称 :Measurement,相当于表名
- 标签键值对(可选):Tag Set,相当于索引,
- 字段键值对: Field Set,相当于数据列
- 时间戳(可选):Timestamp,相当于时间戳
<measurement>[,<tag_key>=<tag_value>[,<tag_key>=<tag_value>...]] <field_key>=<field_value>[,<field_key>=<field_value>...] <timestamp>其中第一个空格分隔Measurement和Tag Set,第二个空格分隔Tag Set和Field Set,第三个空格分隔Field Set和Timestamp。Timestamp是可选的,如果不指定,Influxdb会使用当前时间作为时间戳。
Influxdb数据类型
Influxdb支持以下几种数据类型:
- 整数类型:int64,需要在结尾加上i
- 无符号整数类型:uint64,需要在结尾加上u
- 浮点数类型:float64
- 字符串类型:string
- 布尔类型:boolean
- 时间戳类型:int64(以纳秒为单位)
Telegraf
Telegraf是一个开源的数据收集器,用于收集各种系统和应用程序的指标数据。Telegraf支持多种数据源和输出插件,可以将数据发送到Influxdb等时序数据库中。Telegraf的配置文件可以定义数据源、输出插件和其他配置选项。Telegraf的数据收集过程可以分为以下几个步骤:
数据源:Telegraf支持多种数据源,例如文件、网络接口、系统指标、应用程序日志等。数据源插件负责从数据源中读取数据,并将其转换为Telegraf的内部数据格式。
配置文件: 输入数据为可选插件,可通过telegraf.conf文件进行配置,例如:CPU net mem disk等,在UI界面中创建之后就可以配置,随后启动telegraf服务时,指定这个配置文件即可。
# Configuration for telegraf agent
[agent]
  ## Default data collection interval for all inputs
  interval = "10s"
  ## Rounds collection interval to 'interval'
  ## ie, if interval="10s" then always collect on :00, :10, :20, etc.
  round_interval = true

  ## Telegraf will send metrics to outputs in batches of at most
  ## metric_batch_size metrics.
  ## This controls the size of writes that Telegraf sends to output plugins.
  metric_batch_size = 1000

  ## Maximum number of unwritten metrics per output.  Increasing this value
  ## allows for longer periods of output downtime without dropping metrics at the
  ## cost of higher maximum memory usage.
  metric_buffer_limit = 10000

  ## Collection jitter is used to jitter the collection by a random amount.
  ## Each plugin will sleep for a random time within jitter before collecting.
  ## This can be used to avoid many plugins querying things like sysfs at the
  ## same time, which can have a measurable effect on the system.
  collection_jitter = "0s"

  ## Default flushing interval for all outputs. Maximum flush_interval will be
  ## flush_interval + flush_jitter
  flush_interval = "10s"
  ## Jitter the flush interval by a random amount. This is primarily to avoid
  ## large write spikes for users running a large number of telegraf instances.
  ## ie, a jitter of 5s and interval 10s means flushes will happen every 10-15s
  flush_jitter = "0s"

  ## By default or when set to "0s", precision will be set to the same
  ## timestamp order as the collection interval, with the maximum being 1s.
  ##   ie, when interval = "10s", precision will be "1s"
  ##       when interval = "250ms", precision will be "1ms"
  ## Precision will NOT be used for service inputs. It is up to each individual
  ## service input to set the timestamp at the appropriate precision.
  ## Valid time units are "ns", "us" (or "µs"), "ms", "s".
  precision = ""

  ## Log at debug level.
  # debug = false
  ## Log only error level messages.
  # quiet = false

  ## Log target controls the destination for logs and can be one of "file",
  ## "stderr" or, on Windows, "eventlog".  When set to "file", the output file
  ## is determined by the "logfile" setting.
  # logtarget = "file"

  ## Name of the file to be logged to when using the "file" logtarget.  If set to
  ## the empty string then logs are written to stderr.
  # logfile = ""

  ## The logfile will be rotated after the time interval specified.  When set
  ## to 0 no time based rotation is performed.  Logs are rotated only when
  ## written to, if there is no log activity rotation may be delayed.
  # logfile_rotation_interval = "0d"

  ## The logfile will be rotated when it becomes larger than the specified
  ## size.  When set to 0 no size based rotation is performed.
  # logfile_rotation_max_size = "0MB"

  ## Maximum number of rotated archives to keep, any older logs are deleted.
  ## If set to -1, no archives are removed.
  # logfile_rotation_max_archives = 5

  ## Pick a timezone to use when logging or type 'local' for local time.
  ## Example: America/Chicago
  # log_with_timezone = ""

  ## Override default hostname, if empty use os.Hostname()
  hostname = ""
  ## If set to true, do no set the "host" tag in the telegraf agent.
  omit_hostname = false
[[outputs.influxdb_v2]]
  ## The URLs of the InfluxDB cluster nodes.
  ##
  ## Multiple URLs can be specified for a single cluster, only ONE of the
  ## urls will be written to each interval.
  ##   ex: urls = ["https://us-west-2-1.aws.cloud2.influxdata.com"]
  urls = ["http://106.14.135.70:8086"]

  ## Token for authentication.
  token = "$INFLUX_TOKEN"

  ## Organization is the name of the organization you wish to write to; must exist.
  organization = "influxdb"

  ## Destination bucket to write into.
  bucket = "test02"

  ## The value of this tag will be used to determine the bucket.  If this
  ## tag is not set the 'bucket' option is used as the default.
  # bucket_tag = ""

  ## If true, the bucket tag will not be added to the metric.
  # exclude_bucket_tag = false

  ## Timeout for HTTP messages.
  # timeout = "5s"

  ## Additional HTTP headers
  # http_headers = {"X-Special-Header" = "Special-Value"}

  ## HTTP Proxy override, if unset values the standard proxy environment
  ## variables are consulted to determine which proxy, if any, should be used.
  # http_proxy = "http://corporate.proxy:3128"

  ## HTTP User-Agent
  # user_agent = "telegraf"

  ## Content-Encoding for write request body, can be set to "gzip" to
  ## compress body or "identity" to apply no encoding.
  # content_encoding = "gzip"

  ## Enable or disable uint support for writing uints influxdb 2.0.
  # influx_uint_support = false

  ## Optional TLS Config for use on HTTP connections.
  # tls_ca = "/etc/telegraf/ca.pem"
  # tls_cert = "/etc/telegraf/cert.pem"
  # tls_key = "/etc/telegraf/key.pem"
  ## Use TLS but skip chain & host verification
  # insecure_skip_verify = false
# Read metrics about system load & uptime
[[inputs.system]]
[[inputs.net]]
[[inputs.swap]]
[[inputs.diskio]]
[[inputs.disk]]
[[inputs.mem]]- 启动 telegraf
set INFLUX_TOKEN=b7KquxwD8-m3MCLmlRtU_ON7HxGL4jFfVSsUZ8uc_BcO8rdyLTBWUS3UwOzvES7gzOSU8bKVluZFjLg76f1Q_A==
# 指定服务器的配置文件
telegraf -config http://106.14.135.70:8086/api/v2/telegrafs/0fb31283ade81000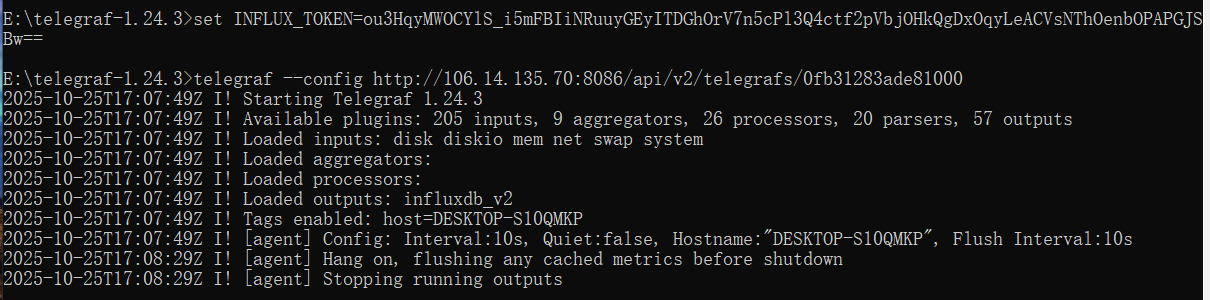
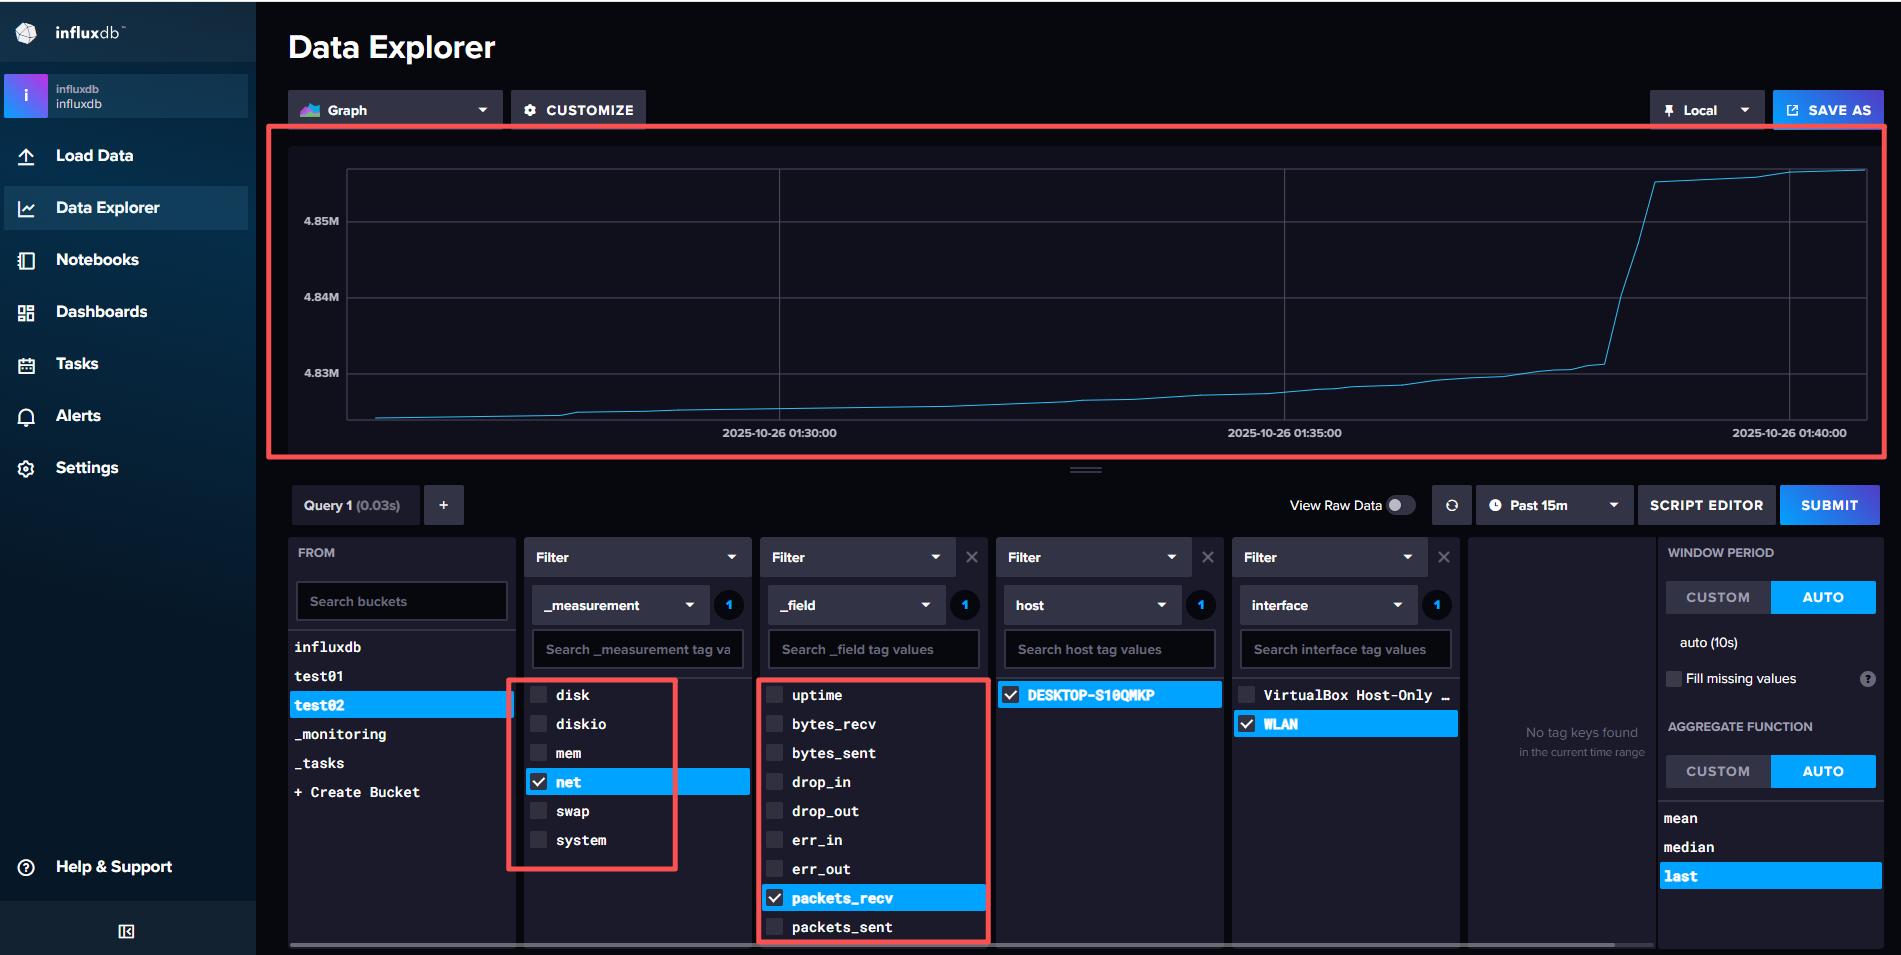
- 查看数据
根据配置文件,我们向 InfluxDB 2.0 写入了数据,现在我们可以通过 InfluxDB 的 Web 界面来查看这些数据。写入的库为test02。通过UI界面查看数据:
Prometheus & SCRAPERS
相比于Telegraf,Prometheus 是一个更强大的监控工具,它支持多种数据源,包括 InfluxDB。因此Influxdb也相应的支持Prometheus的数据源格式,并且可以通过创建SCRAPERS任务,将Prometheus的数据源配置到InfluxDB中。但是要注意的时,想比于telegraf的推送模型,Prometheus是拉取模型,因此需要安装对应的插件暴露对应的接口,通过influxdb的scrapers任务进行拉取。
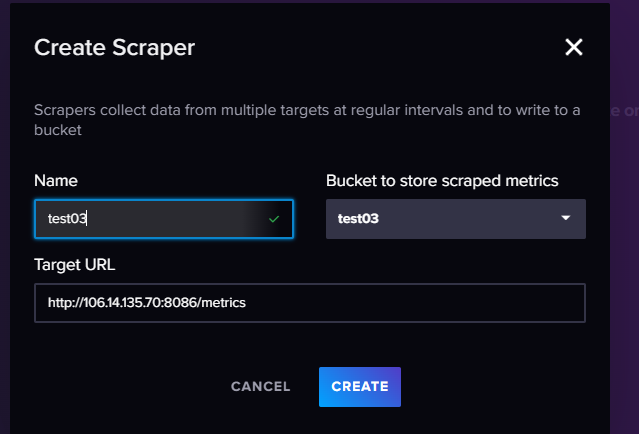
其中主要关注URL,这个是需要我们自己暴露出来的接口(github有大量的开源项目,各种系统的性能指标都能找到对应的项目可以直接使用),保证这个接口满足Prometheus的数据格式,这样数据库中得到的数据就可以直接使用。此处不再重复演示。
influxdb数据模型
foodships,park_id=1,plant=Earth #_foodships=0 timestamp
foodships,park_id=1,plant=Earth #_foodships=2 timestamp
foodships,park_id=1,plant=Earth #_foodships=3 timestamp
foodships,park_id=2,plant=Earth #_foodships=0 timestamp
foodships,park_id=2,plant=Earth #_foodships=2 timestamp
foodships,park_id=2,plant=Earth #_foodships=3 timestamp
上述的数据在influxdb中展示的形式为:
name: foodships
tags: park_id=1,plant=Earth
time                  #_foodships
---------------------------------
2022-07-05T08:00:00Z  0
2022-07-05T08:00:00Z  2
2022-07-05T08:00:00Z  3


name: foodships
tags: park_id=2,plant=Earth
time                  #_foodships
---------------------------------
2022-07-05T08:00:00Z  0
2022-07-05T08:00:00Z  2
2022-07-05T08:00:00Z  3
通过这种形式的数据组织方式,通过measurements(度量)和tags(标签)的组合,可以方便的查询到对应的批量数据。同时也减少了数据的冗余,方便了数据的查询。在进行数据查询时,一般按照以下的操作方式:
- 指定从哪个存储桶中查询数据(Bucket)
- 指定数据的时间范围
- 指定measurements,tag_set,field指定查询的具体序列
从实现的形式上来看,其实measurements,tag,field都是倒排索引,通过数据查询id,然后通过id查询到具体的数据。
此外,influxdb需要注意序列的数量,如果序列过多会导致读取和写入性能有明显的下降,因此标签必须为可以枚举穷尽的数据,否则会导致序列过多,从而影响性能。
influxdb操作API
- 引入依赖
implementation "com.influxdb:influxdb-client-java:6.6.0"- 配置文件
spring:
  application:
    name: influxdb

influx:
  token: fLEwngJ4Su0bzgdYE4ZMmyjKt1jiAMTxEYRuQ0Eu7haQ6wablzO0Z3yjZ7GE8bkqC8TaiY3GBj5bwz9q6STwQQ==
  url: http://106.14.135.70:8086
  bucket: test03
org: fanrencli- 创建配置类
package com.example.influxdb;

import com.influxdb.client.InfluxDBClient;
import com.influxdb.client.InfluxDBClientFactory;
import org.springframework.beans.factory.annotation.Value;
import org.springframework.context.annotation.Bean;
import org.springframework.context.annotation.Configuration;

@Configuration
public class influxdbConfig {
    @Value("${influx.token}")
    private String token;
    @Value("${influx.url}")
    private String url;
    @Value("${influx.org}")
    private String org;
    @Value("${influx.bucket}")
    private String bucket;

    @Bean
    public InfluxDBClient influxDBClient() {
        return InfluxDBClientFactory.create(url, token.toCharArray(), org, bucket);
    }

}- API测试
package com.example.influxdb;

import com.influxdb.annotations.Column;
import com.influxdb.client.InfluxDBClient;
import com.influxdb.client.WriteApiBlocking;
import com.influxdb.client.domain.WritePrecision;
import com.influxdb.client.write.Point;
import org.junit.jupiter.api.Test;
import org.springframework.beans.factory.annotation.Autowired;
import org.springframework.boot.test.context.SpringBootTest;

import java.time.Instant;

@SpringBootTest
class InfluxdbApplicationTests {


    public static class DemoObject {
        @Column(measurement = true)
        private String measurment;
        @Column(tag = true)
        private String locaion;
        @Column
        private Double value;
        @Column(timestamp = true)
        private Instant timestamp;

        public DemoObject(String measurment, String locaion, Double value, Instant timestamp) {
            this.measurment = measurment;
            this.locaion = locaion;
            this.value = value;
            this.timestamp = timestamp;
        }
    }

    @Autowired
    private InfluxDBClient client;

    @Test
    void contextLoads() {
        String data = "mem,host=host1 used_percent=23.43234543";

        WriteApiBlocking writeApi = client.getWriteApiBlocking();
        // 通过字符串手动构建行协议
        writeApi.writeRecord(WritePrecision.MS, "temperature,location=SH value=50");

        // 通过point构造入参
        Point point = Point.measurement("temperature")
                .addTag("location", "SH")
                .addField("value", 70.0)
                .time(Instant.now(), WritePrecision.MS);
        writeApi.writePoint(point);
        // 通过自定义对象构造入参
        new DemoObject("temperature","SH",100.0,Instant.now());
        client.close();
    }
    @Test
    void contextLoads() {
        String data = "mem,host=host1 used_percent=23.43234543";

        // 异步写入的逻辑,开启线程池
        WriteOptions writeOptions = WriteOptions.builder().batchSize(100).build();
        WriteApi writeApi = client.makeWriteApi(writeOptions);
        // 将数据写入缓冲区,线程池每隔1s处理一次
        writeApi.writeRecord(WritePrecision.MS, "temperature,location=SH value=50");
        // 清空缓存,将所有数据写入
        writeApi.flush();
        client.close();
    }
}
定时任务
定时任务是influxdb中一个比较重要的功能,通过定时任务,可以定时执行一些操作,一般的使用场景为:降采样,聚合操作以及触发信号,比如定时删除数据,定时备份数据等。定时任务中存在数据迟到问题,因此在执行任务时设置offset来延迟执行任务。
定时任务在influxdb中是通过cron表达式来实现的,通过cron表达式可以精确的控制定时任务的执行时间。表达式可以参照如下:
* * * * * * *
┬ ┬ ┬ ┬ ┬ ┬ ┬
│ │ │ │ │ │ │
│ │ │ │ │ │ └ 星期几 (0 - 7) (0 或 7 是星期天)
│ │ │ │ │ └───── 月份 (1 - 12)
│ │ │ │ └────────── 日 (1 - 31)
│ │ │ └───────────── 小时 (0 - 23)
│ │ └──────────────── 分钟 (0 - 59)
│ └───────────────────── 秒 (0 - 59, 可选)
└───────────────────────── 年份 (可选)
仪表盘创建
- 创建仪表盘
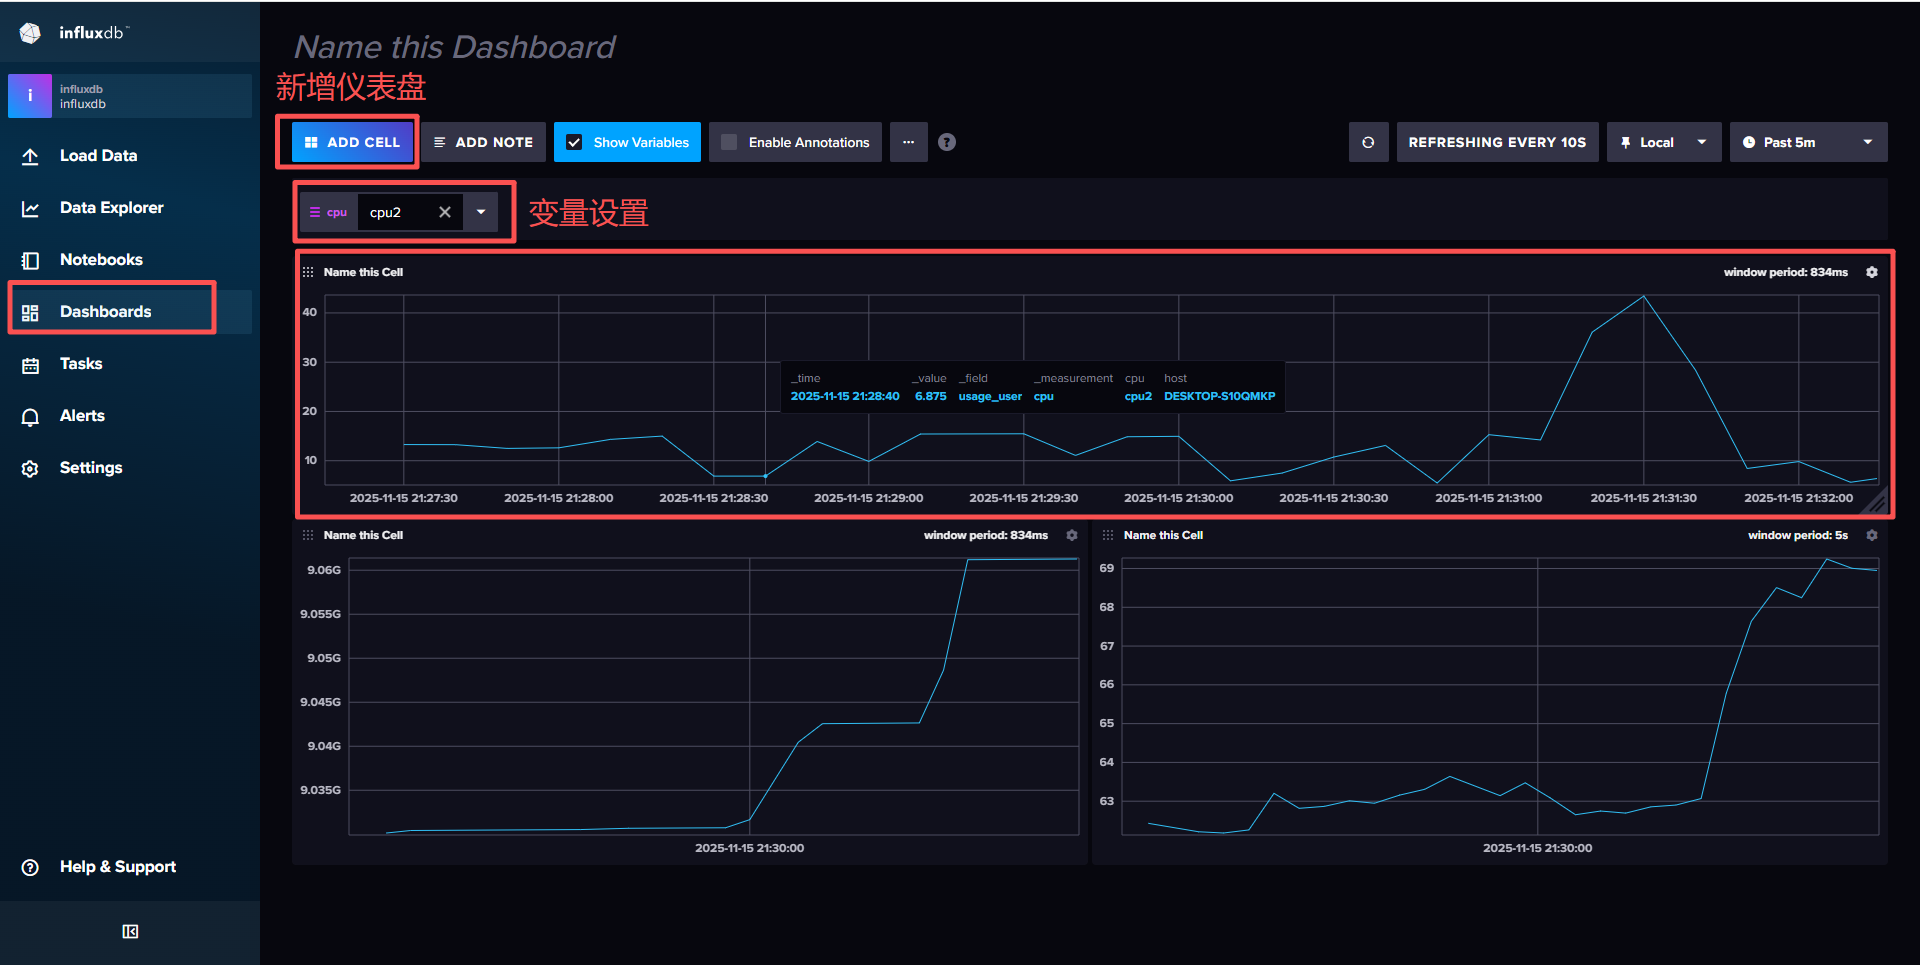
报警实践
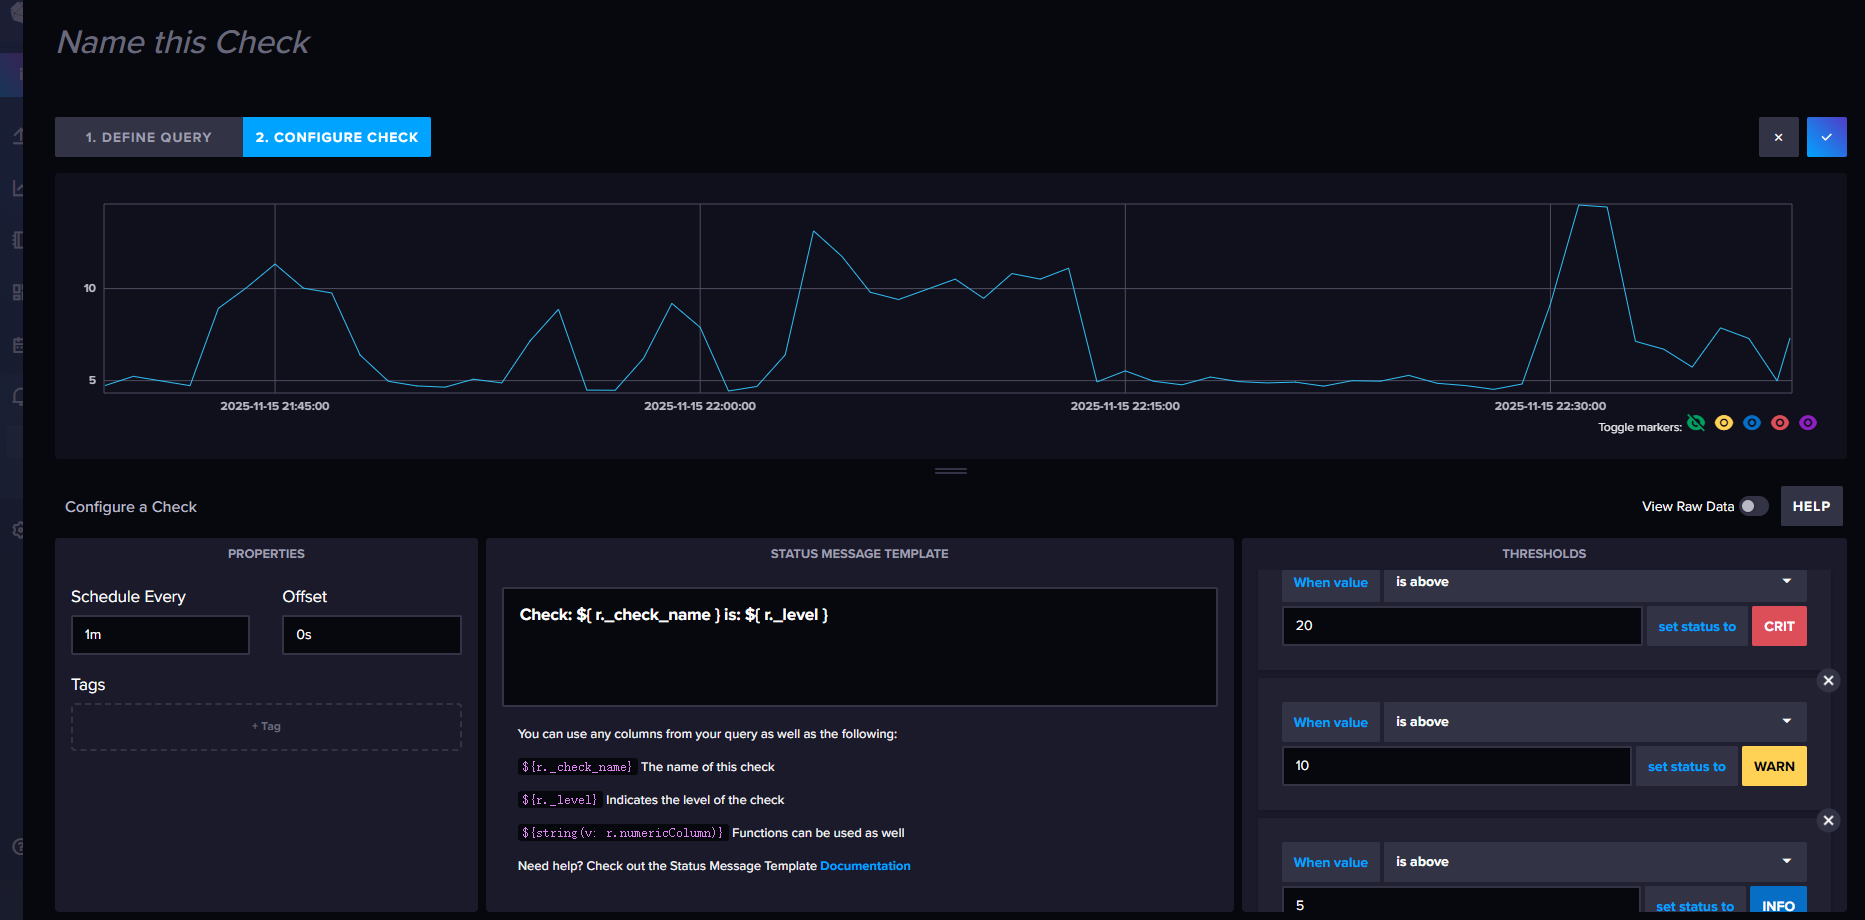
influxdb支持通过数据库中的数据来触发报警,当数据满足条件时,会触发报警,并通知到指定的用户。报警的实践逻辑主要分为以下三个部分:
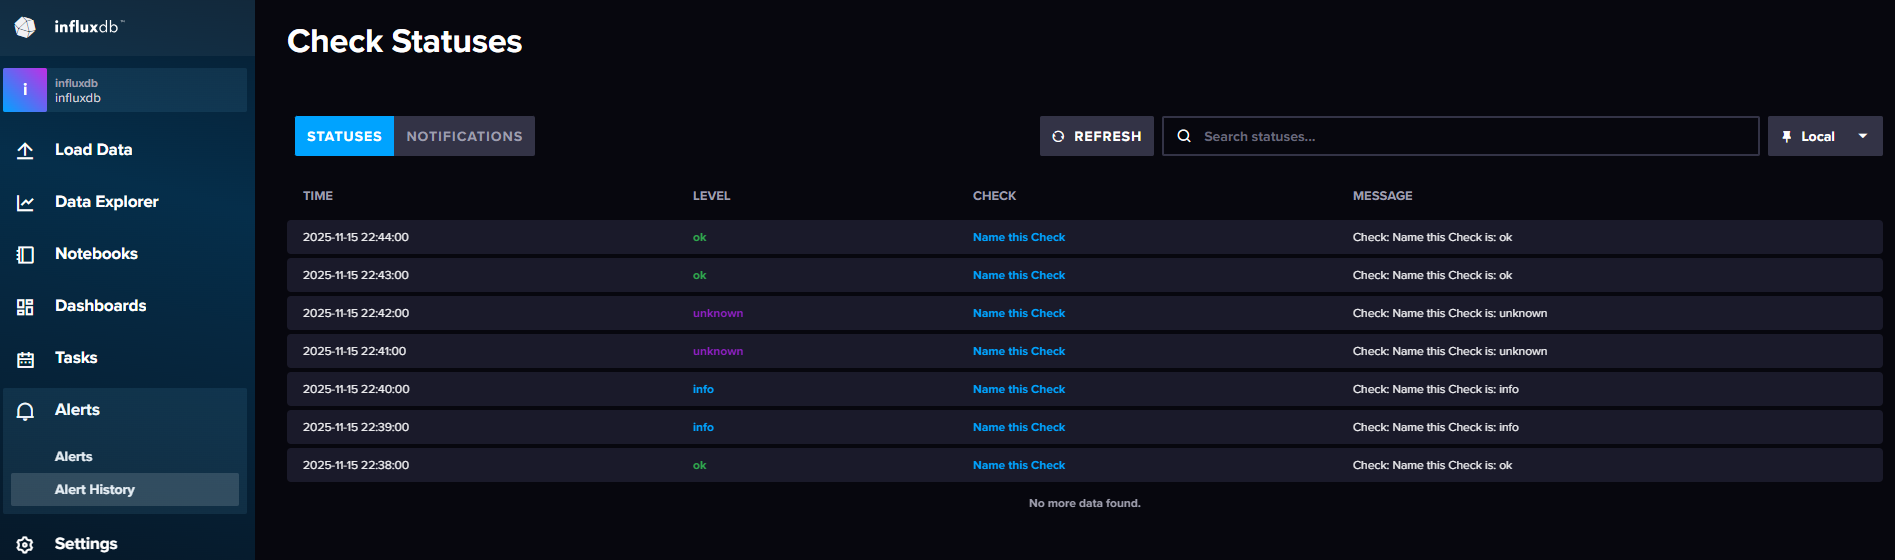
check检查点:主要是定义报警的条件,比如数据是否大于某个值,数据是否在某个区间内等。定时任务会定时检查数据是否满足条件,如果满足条件,则会将信息写入_monitoring。
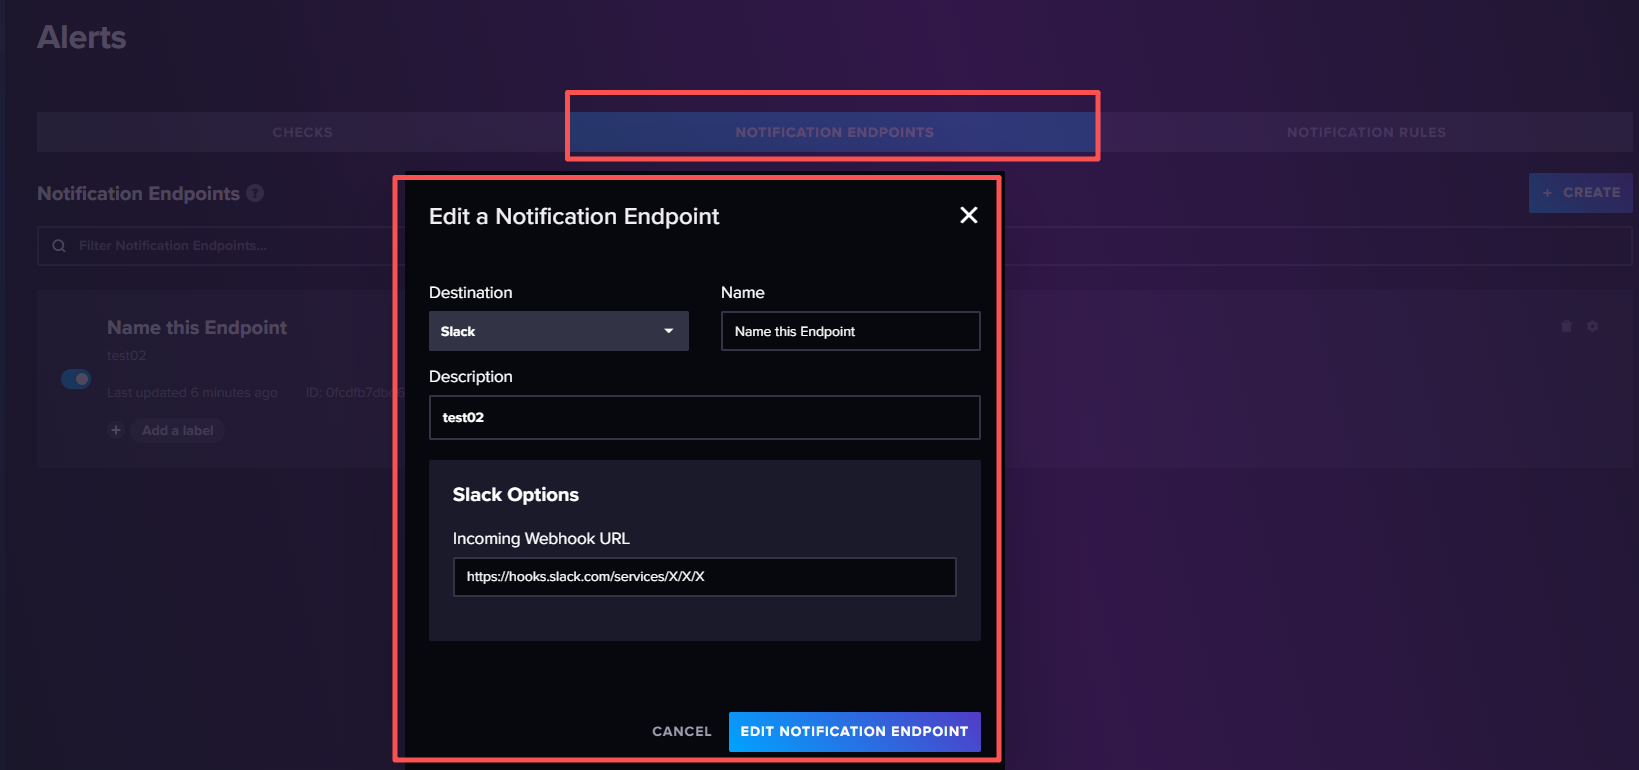
告警终端:主要是定义报警的通知方式,比如发送邮件,发送短信等。当check检查点触发报警时,会将信息发送到指定的终端。
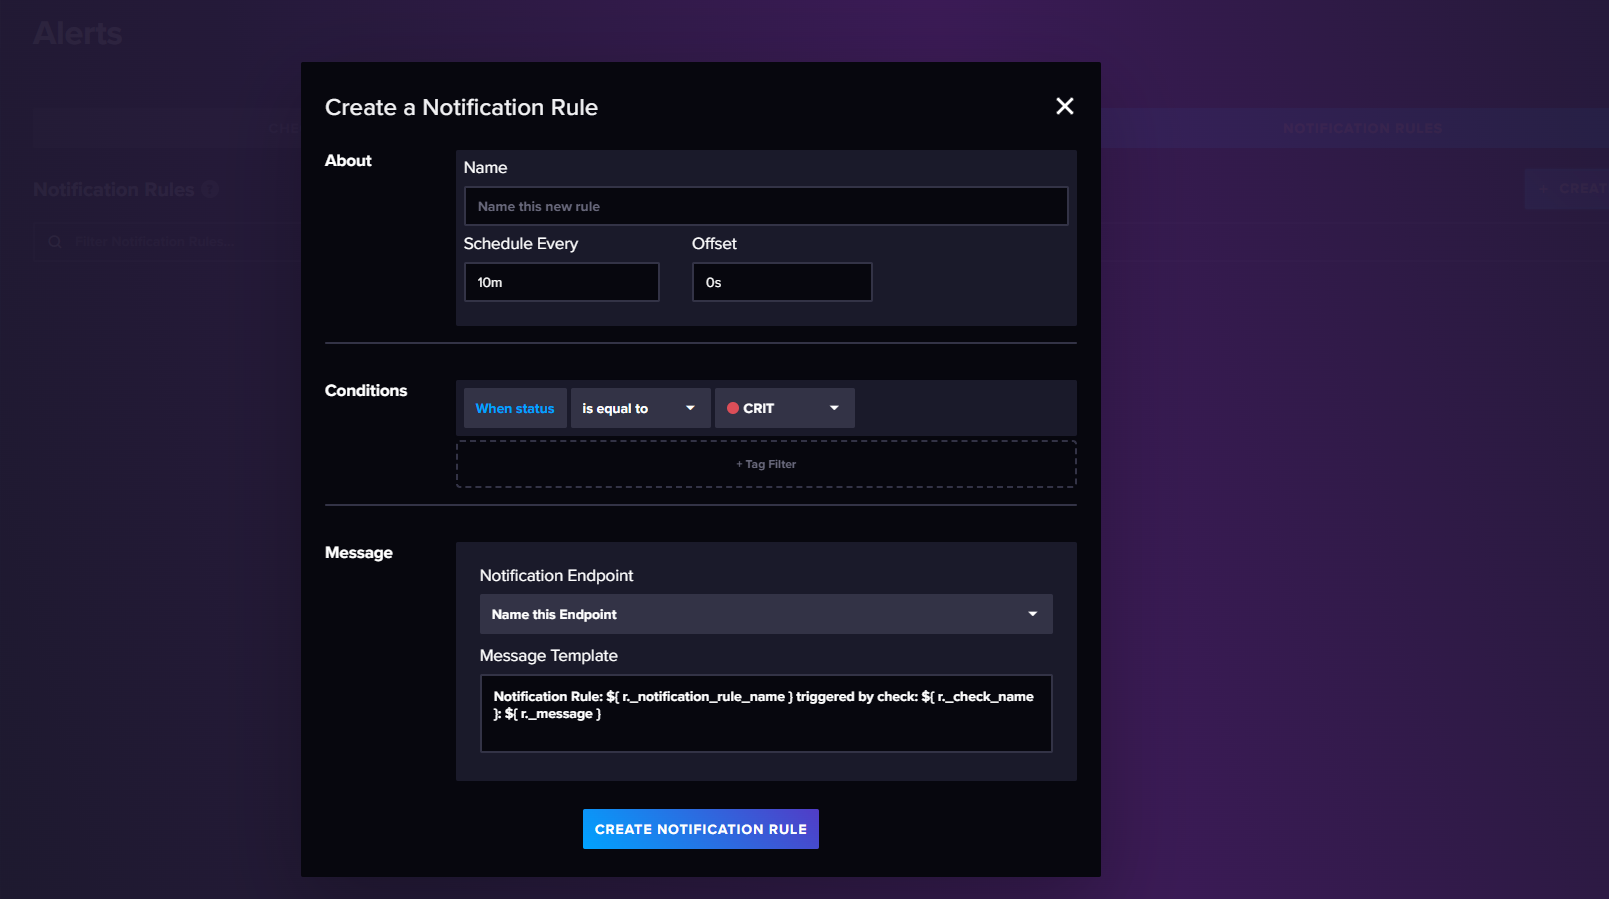
告警规则:主要是定义报警的规则,当检查点将数据写入_monitoring中后,告警规则会根据设置的条件对检查信息进行过滤,符合条件的就会触发告警,将告警信息发送到告警终端,由告警终端继续处理。
创建告警检查点:CPU的阈值范围:<50:ok,50-70:info,70-80:warning,>80:critical
创建告警终端:
创建告警规则: